QA catalogue könyvtári adatok elemzéséhez
KBR (Koninklijke Bibliotheek van België/Bibliothèque royale de Belgique)
rekordok száma: 4,847,249 utolsó frissítés: 2025-01-12 22:15
rekordok száma: 4,847,249 utolsó frissítés: 2025-01-12 22:15
Field frequency distribution
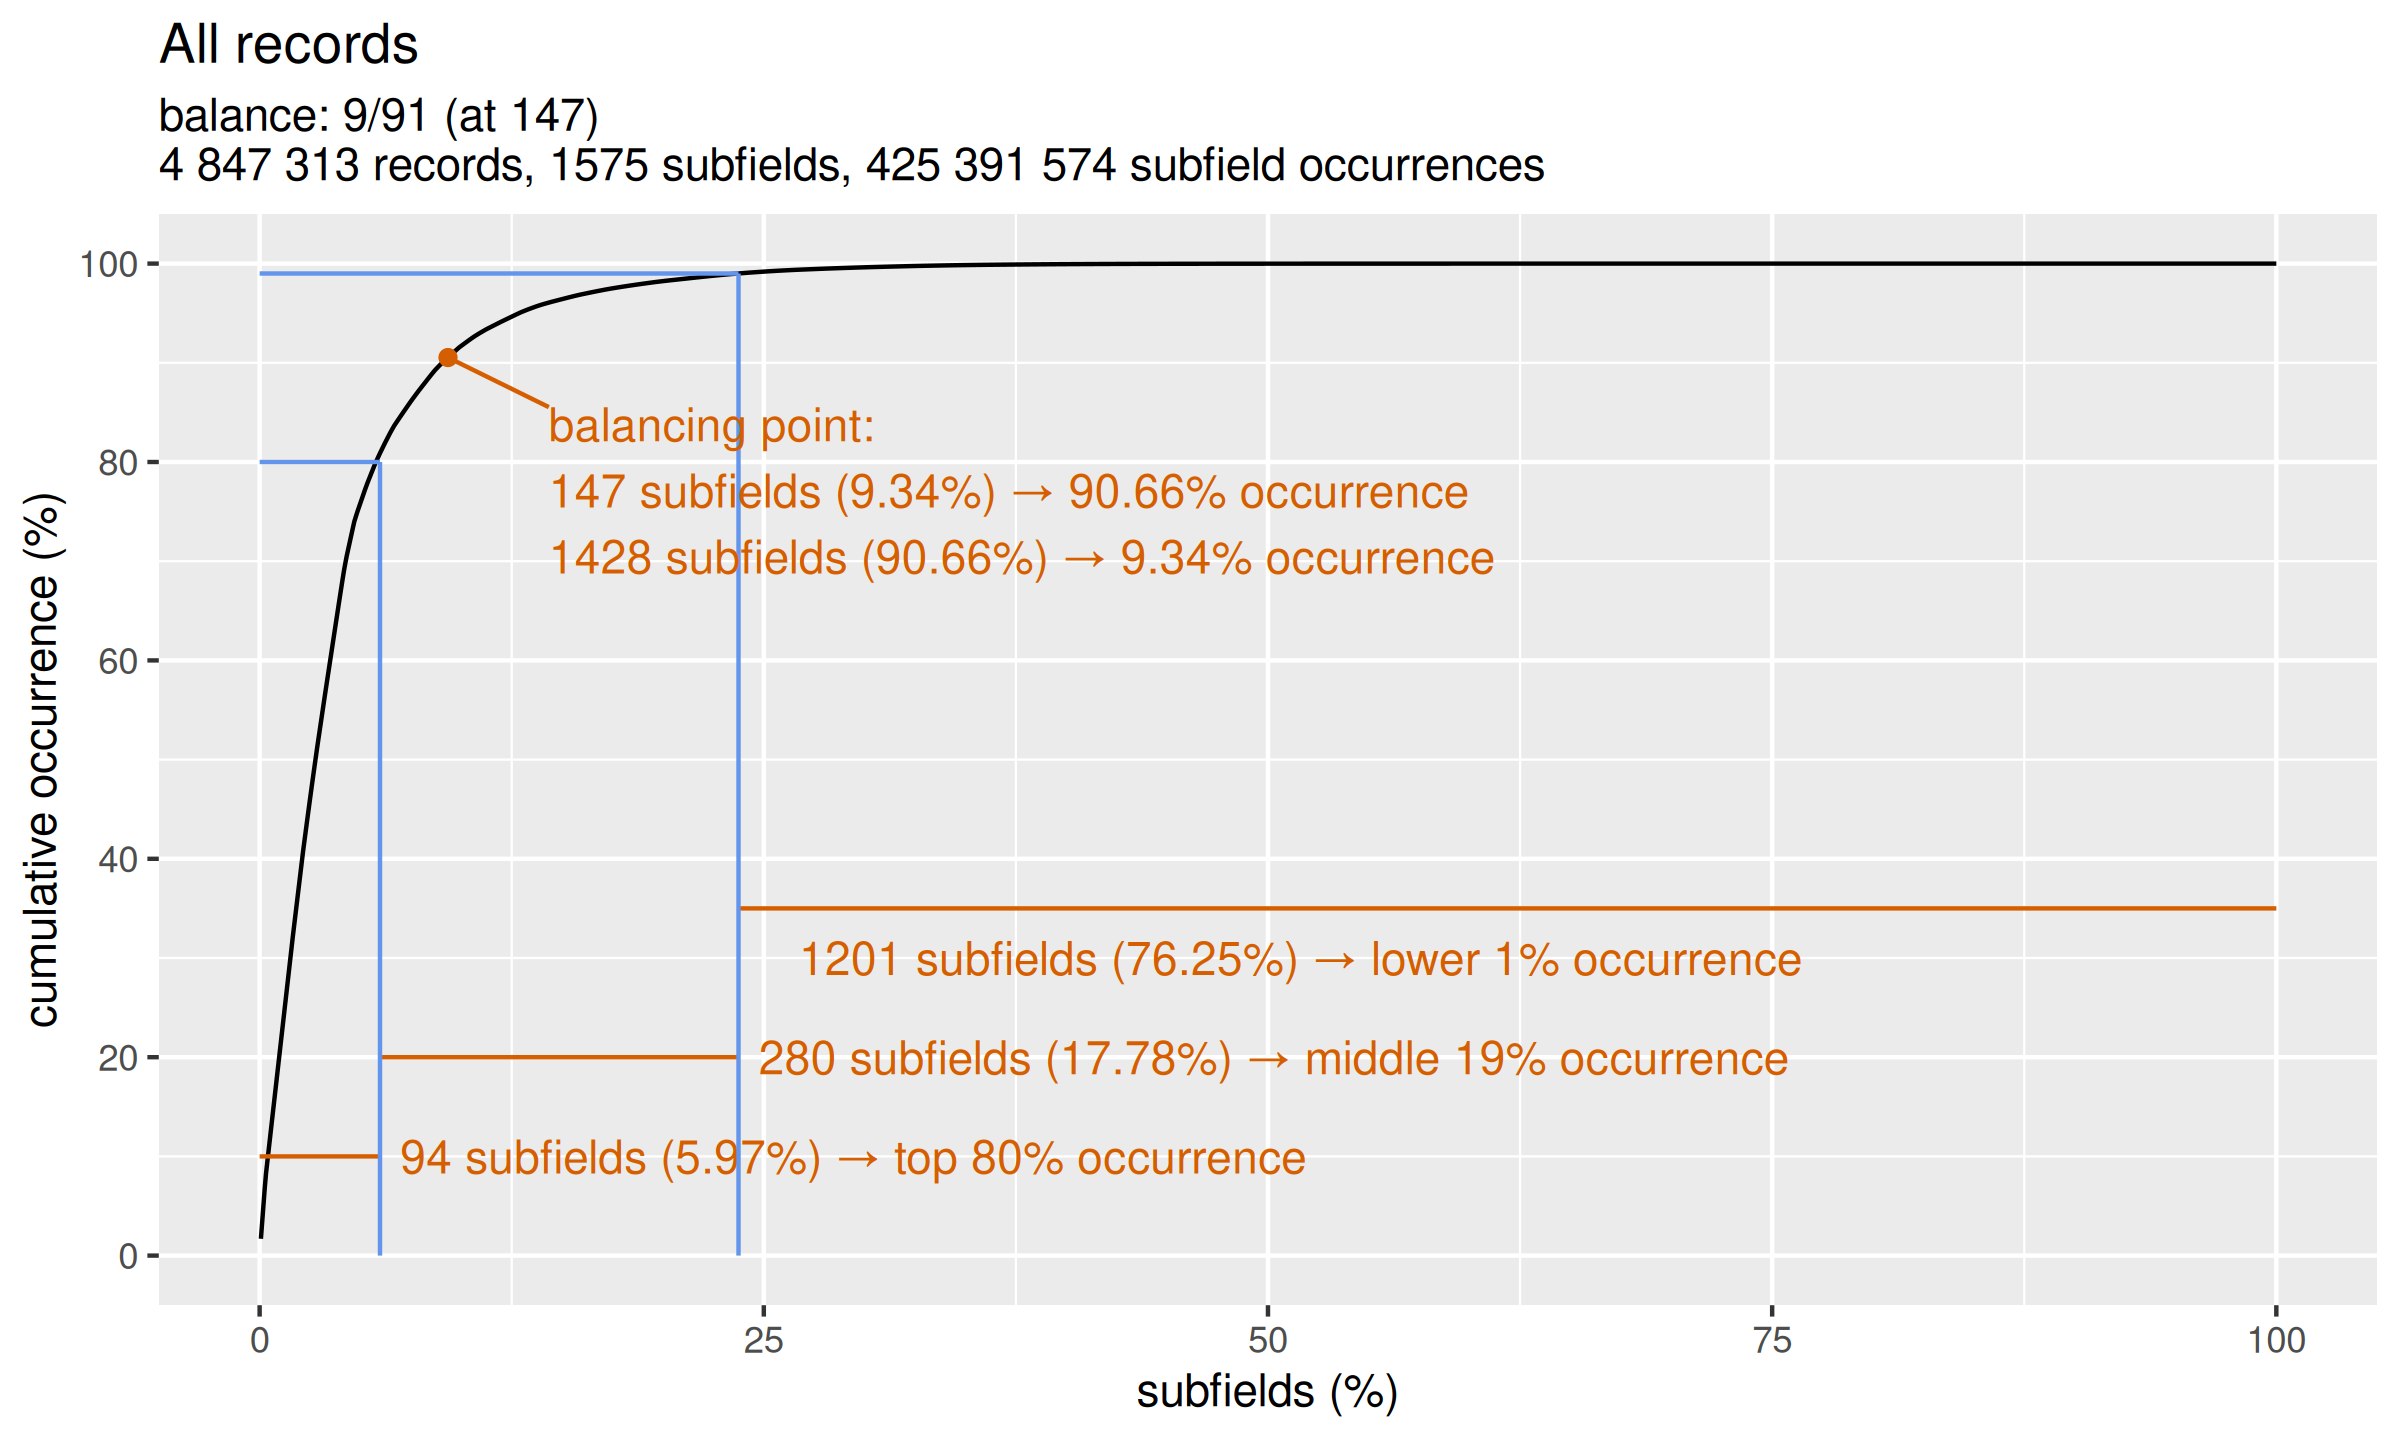
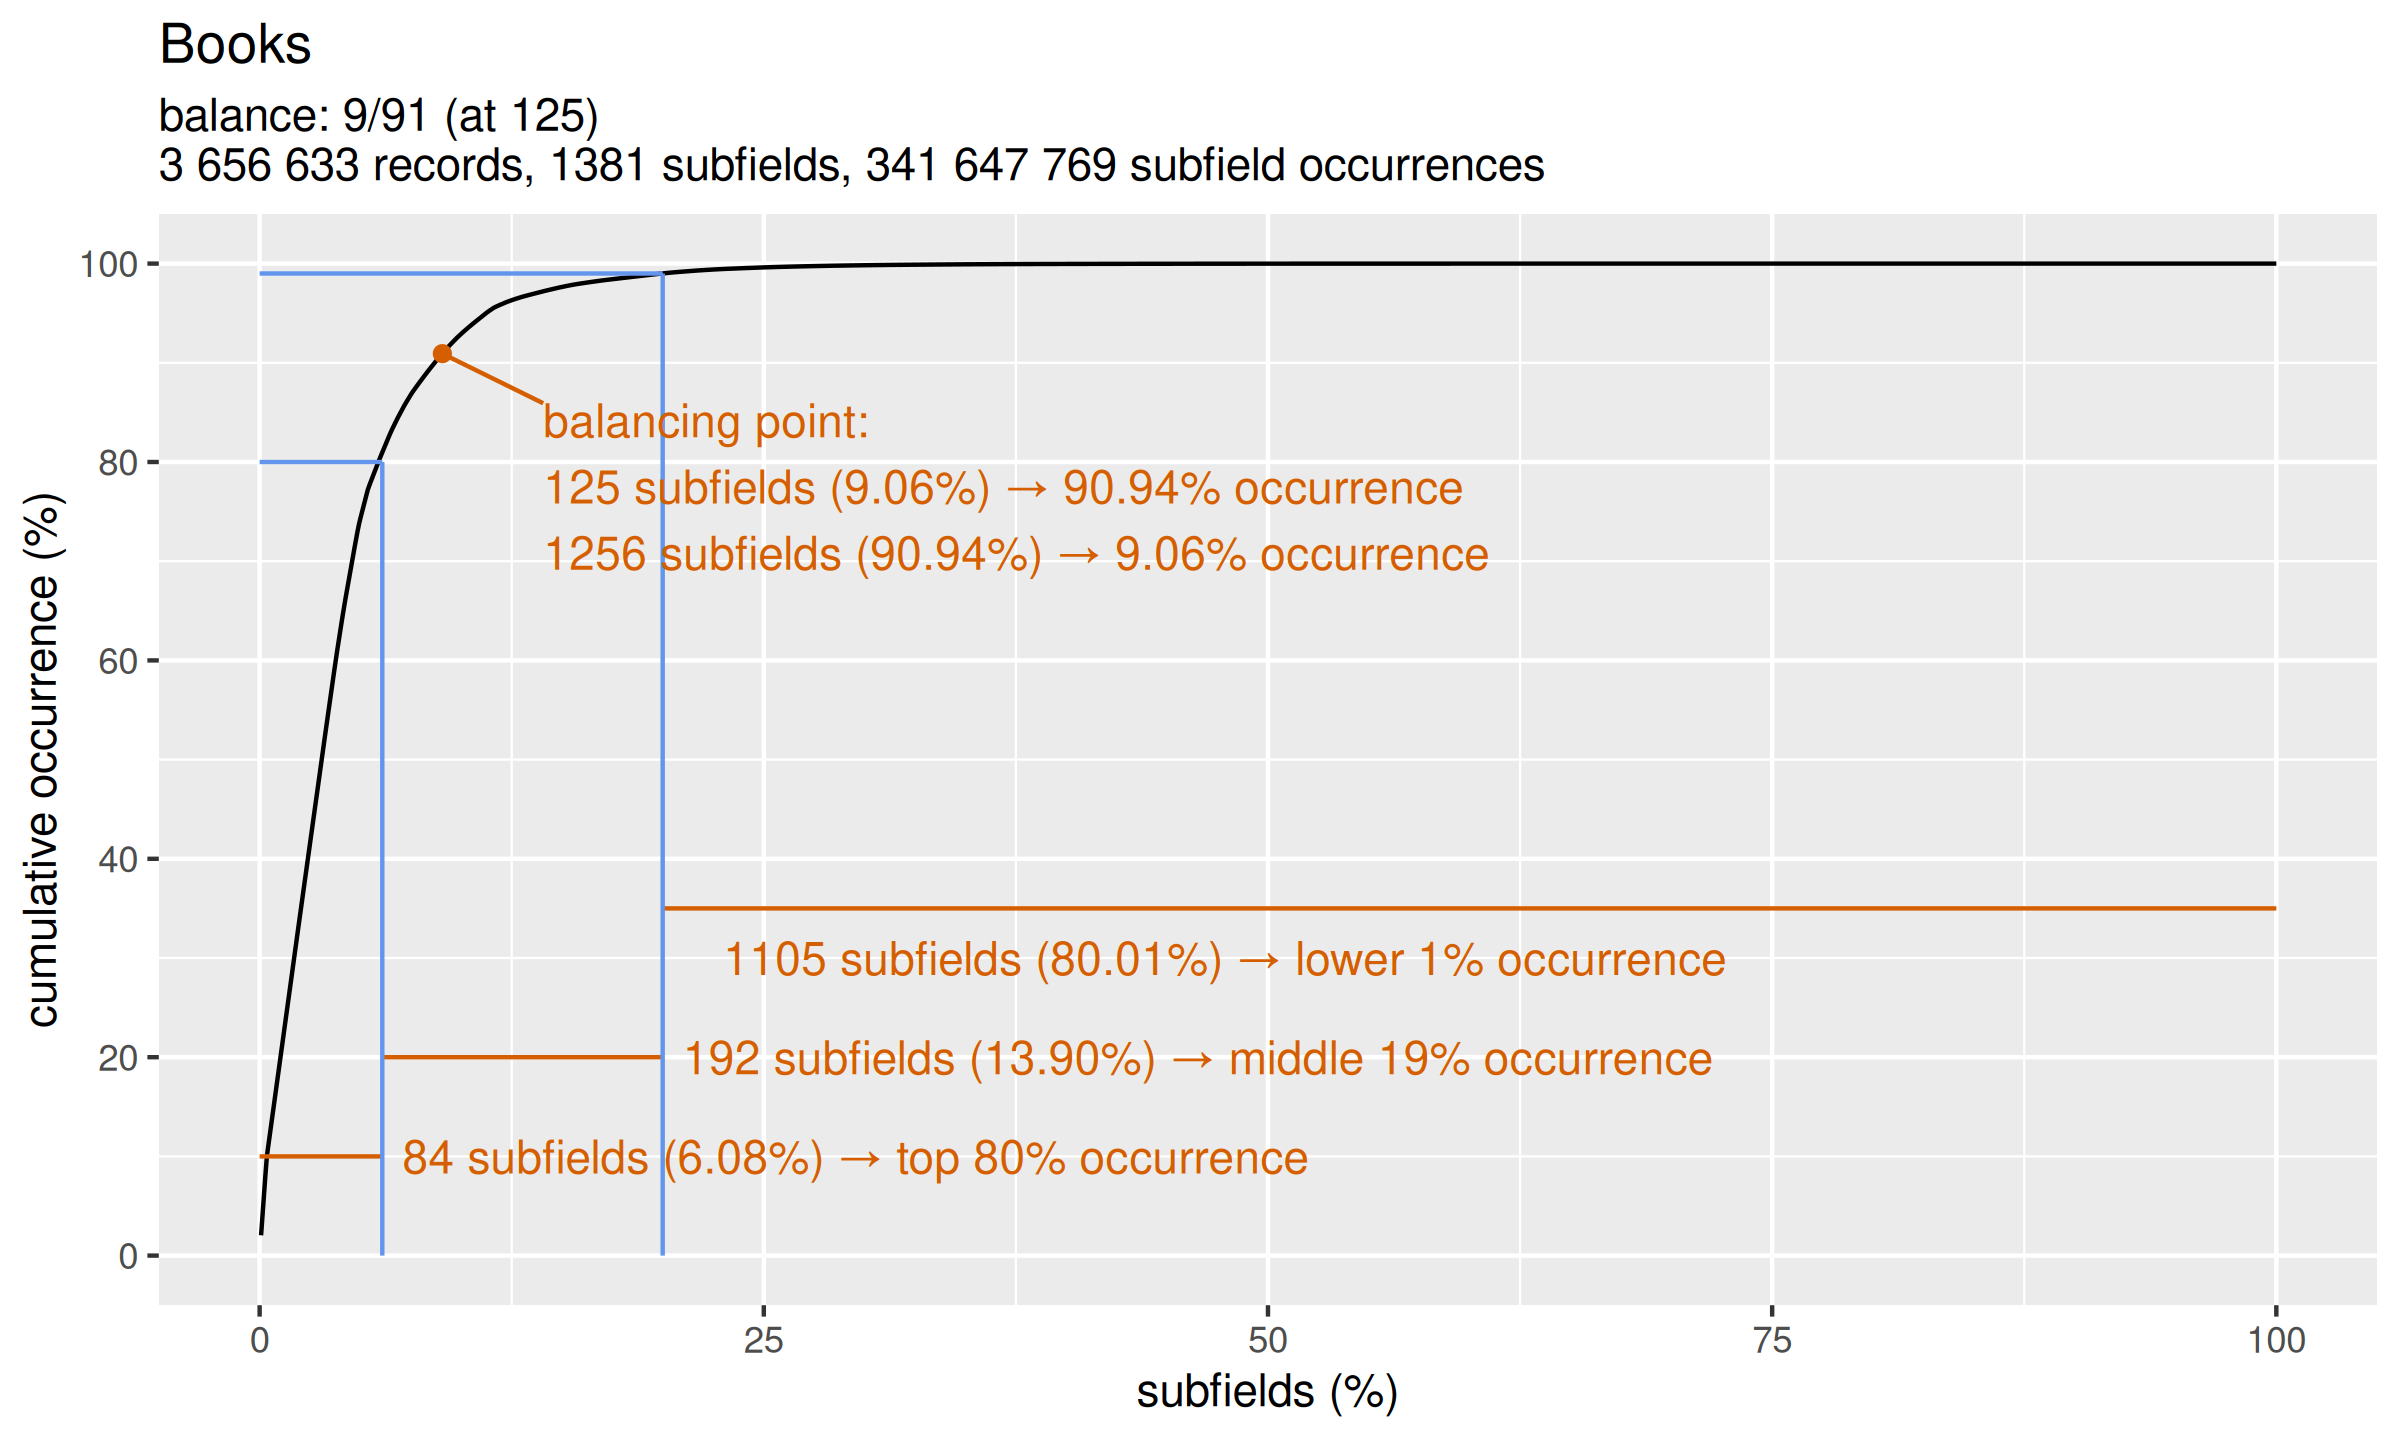
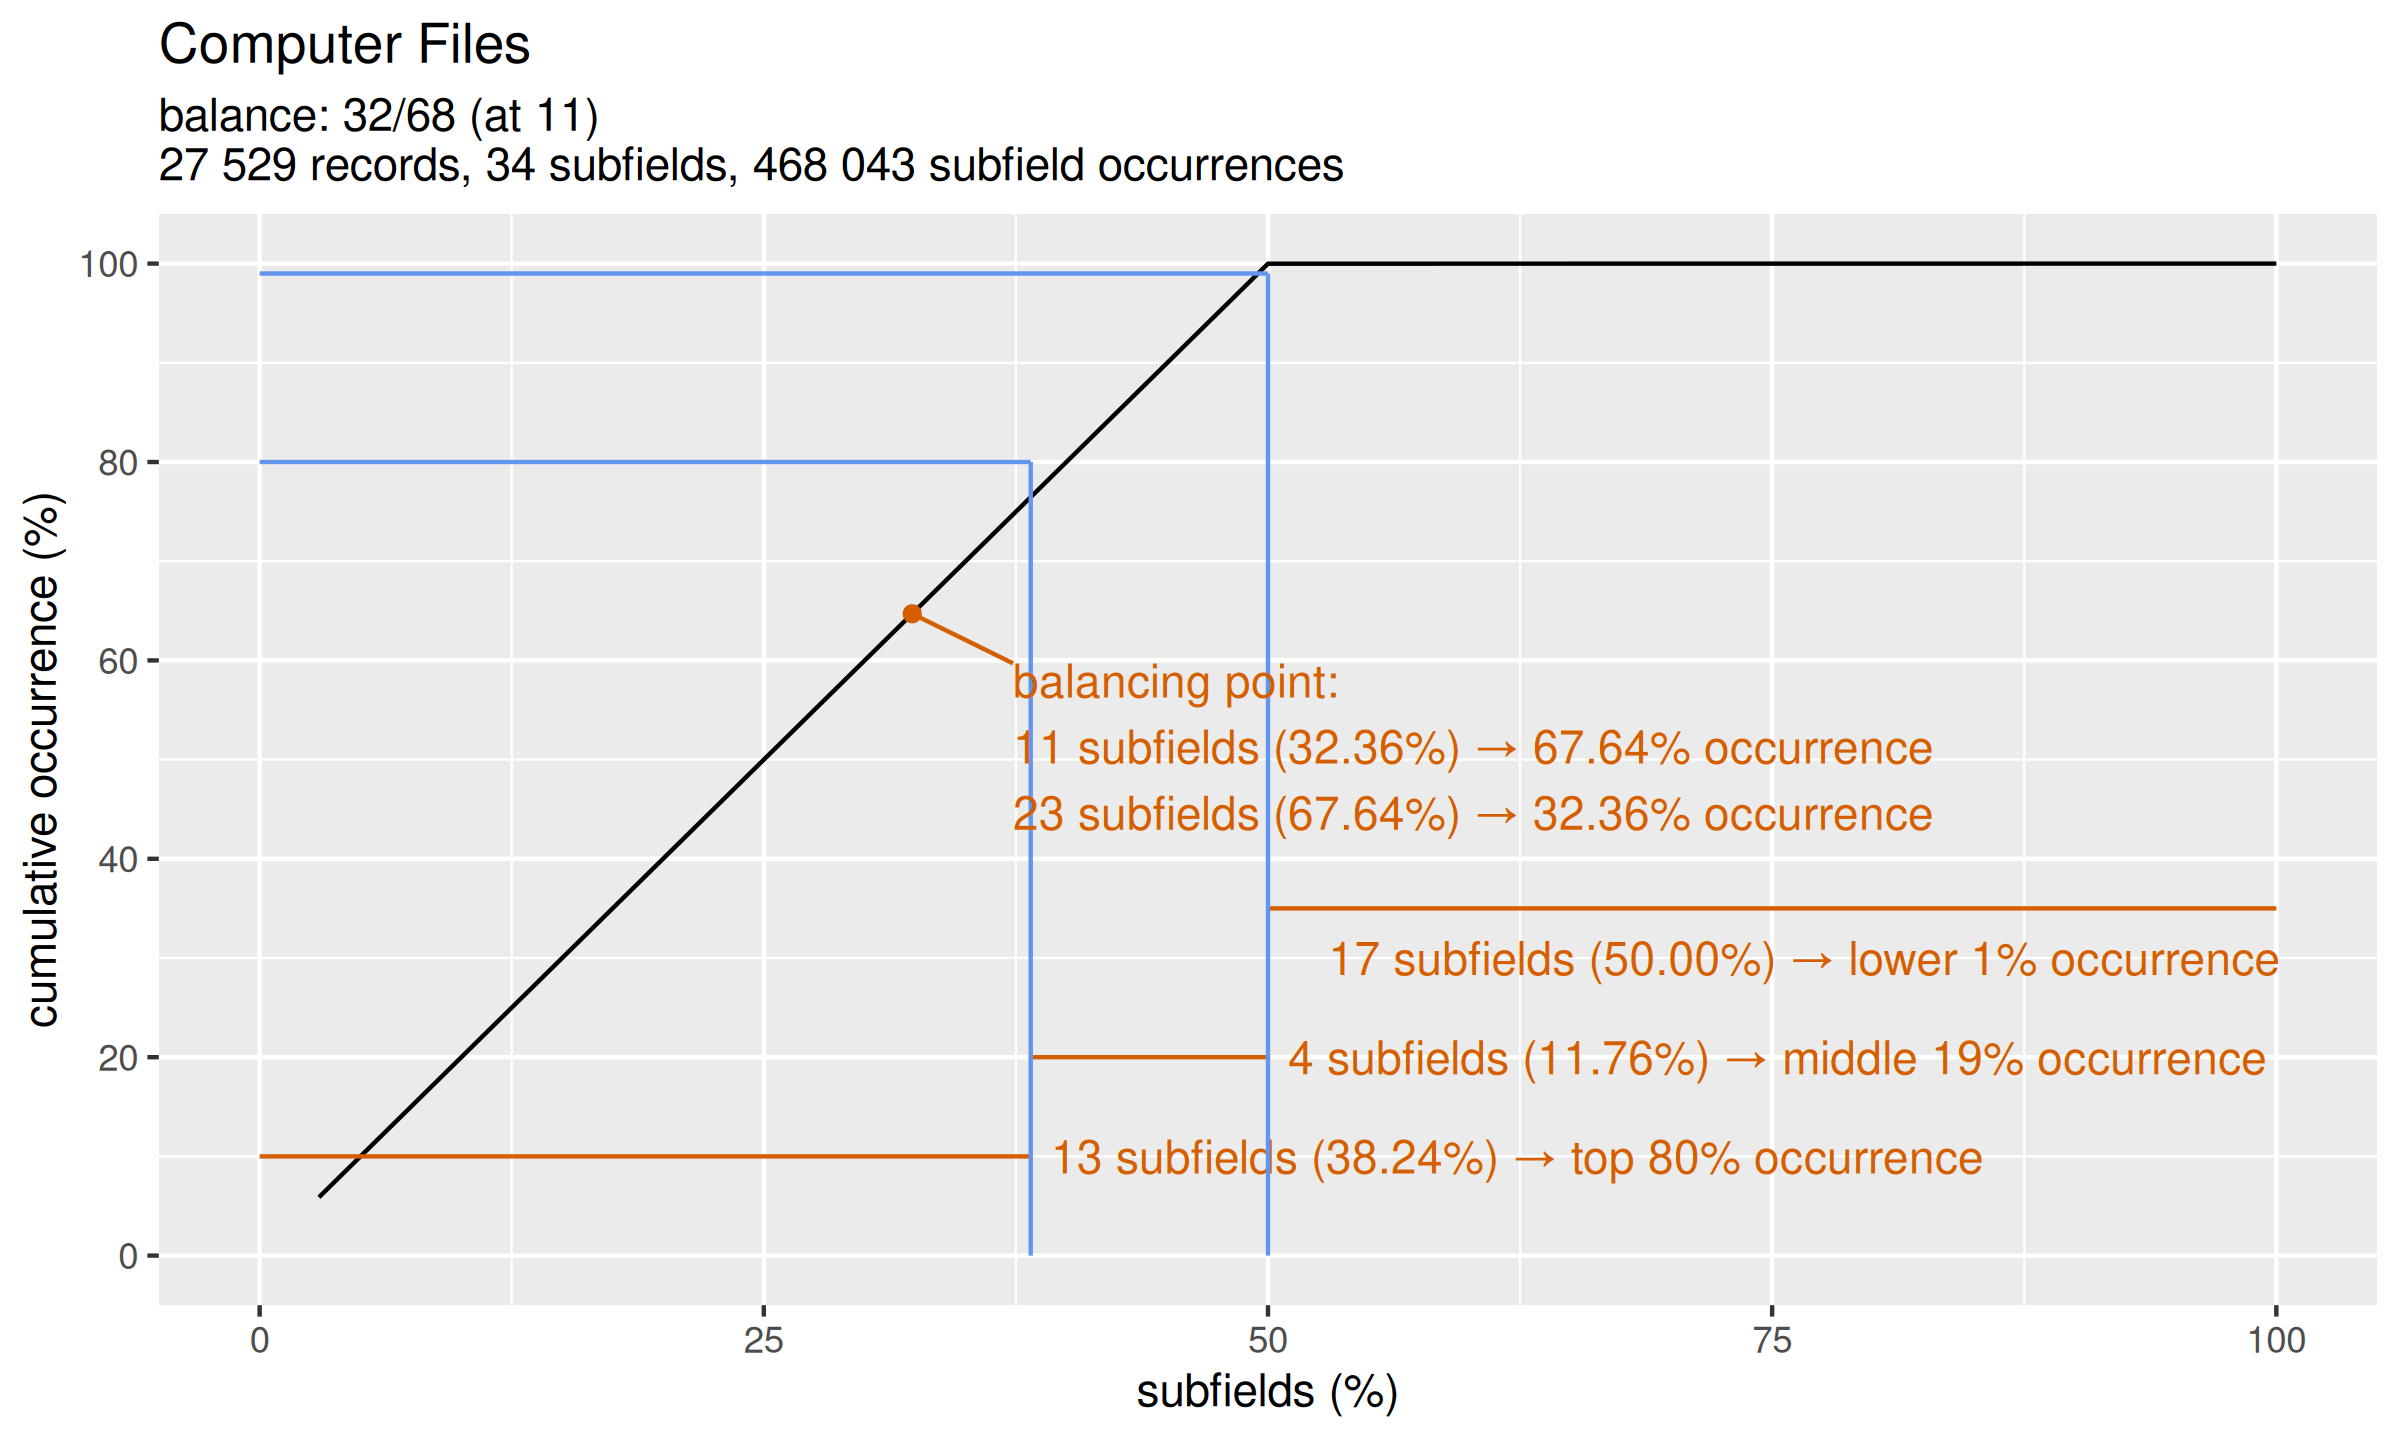
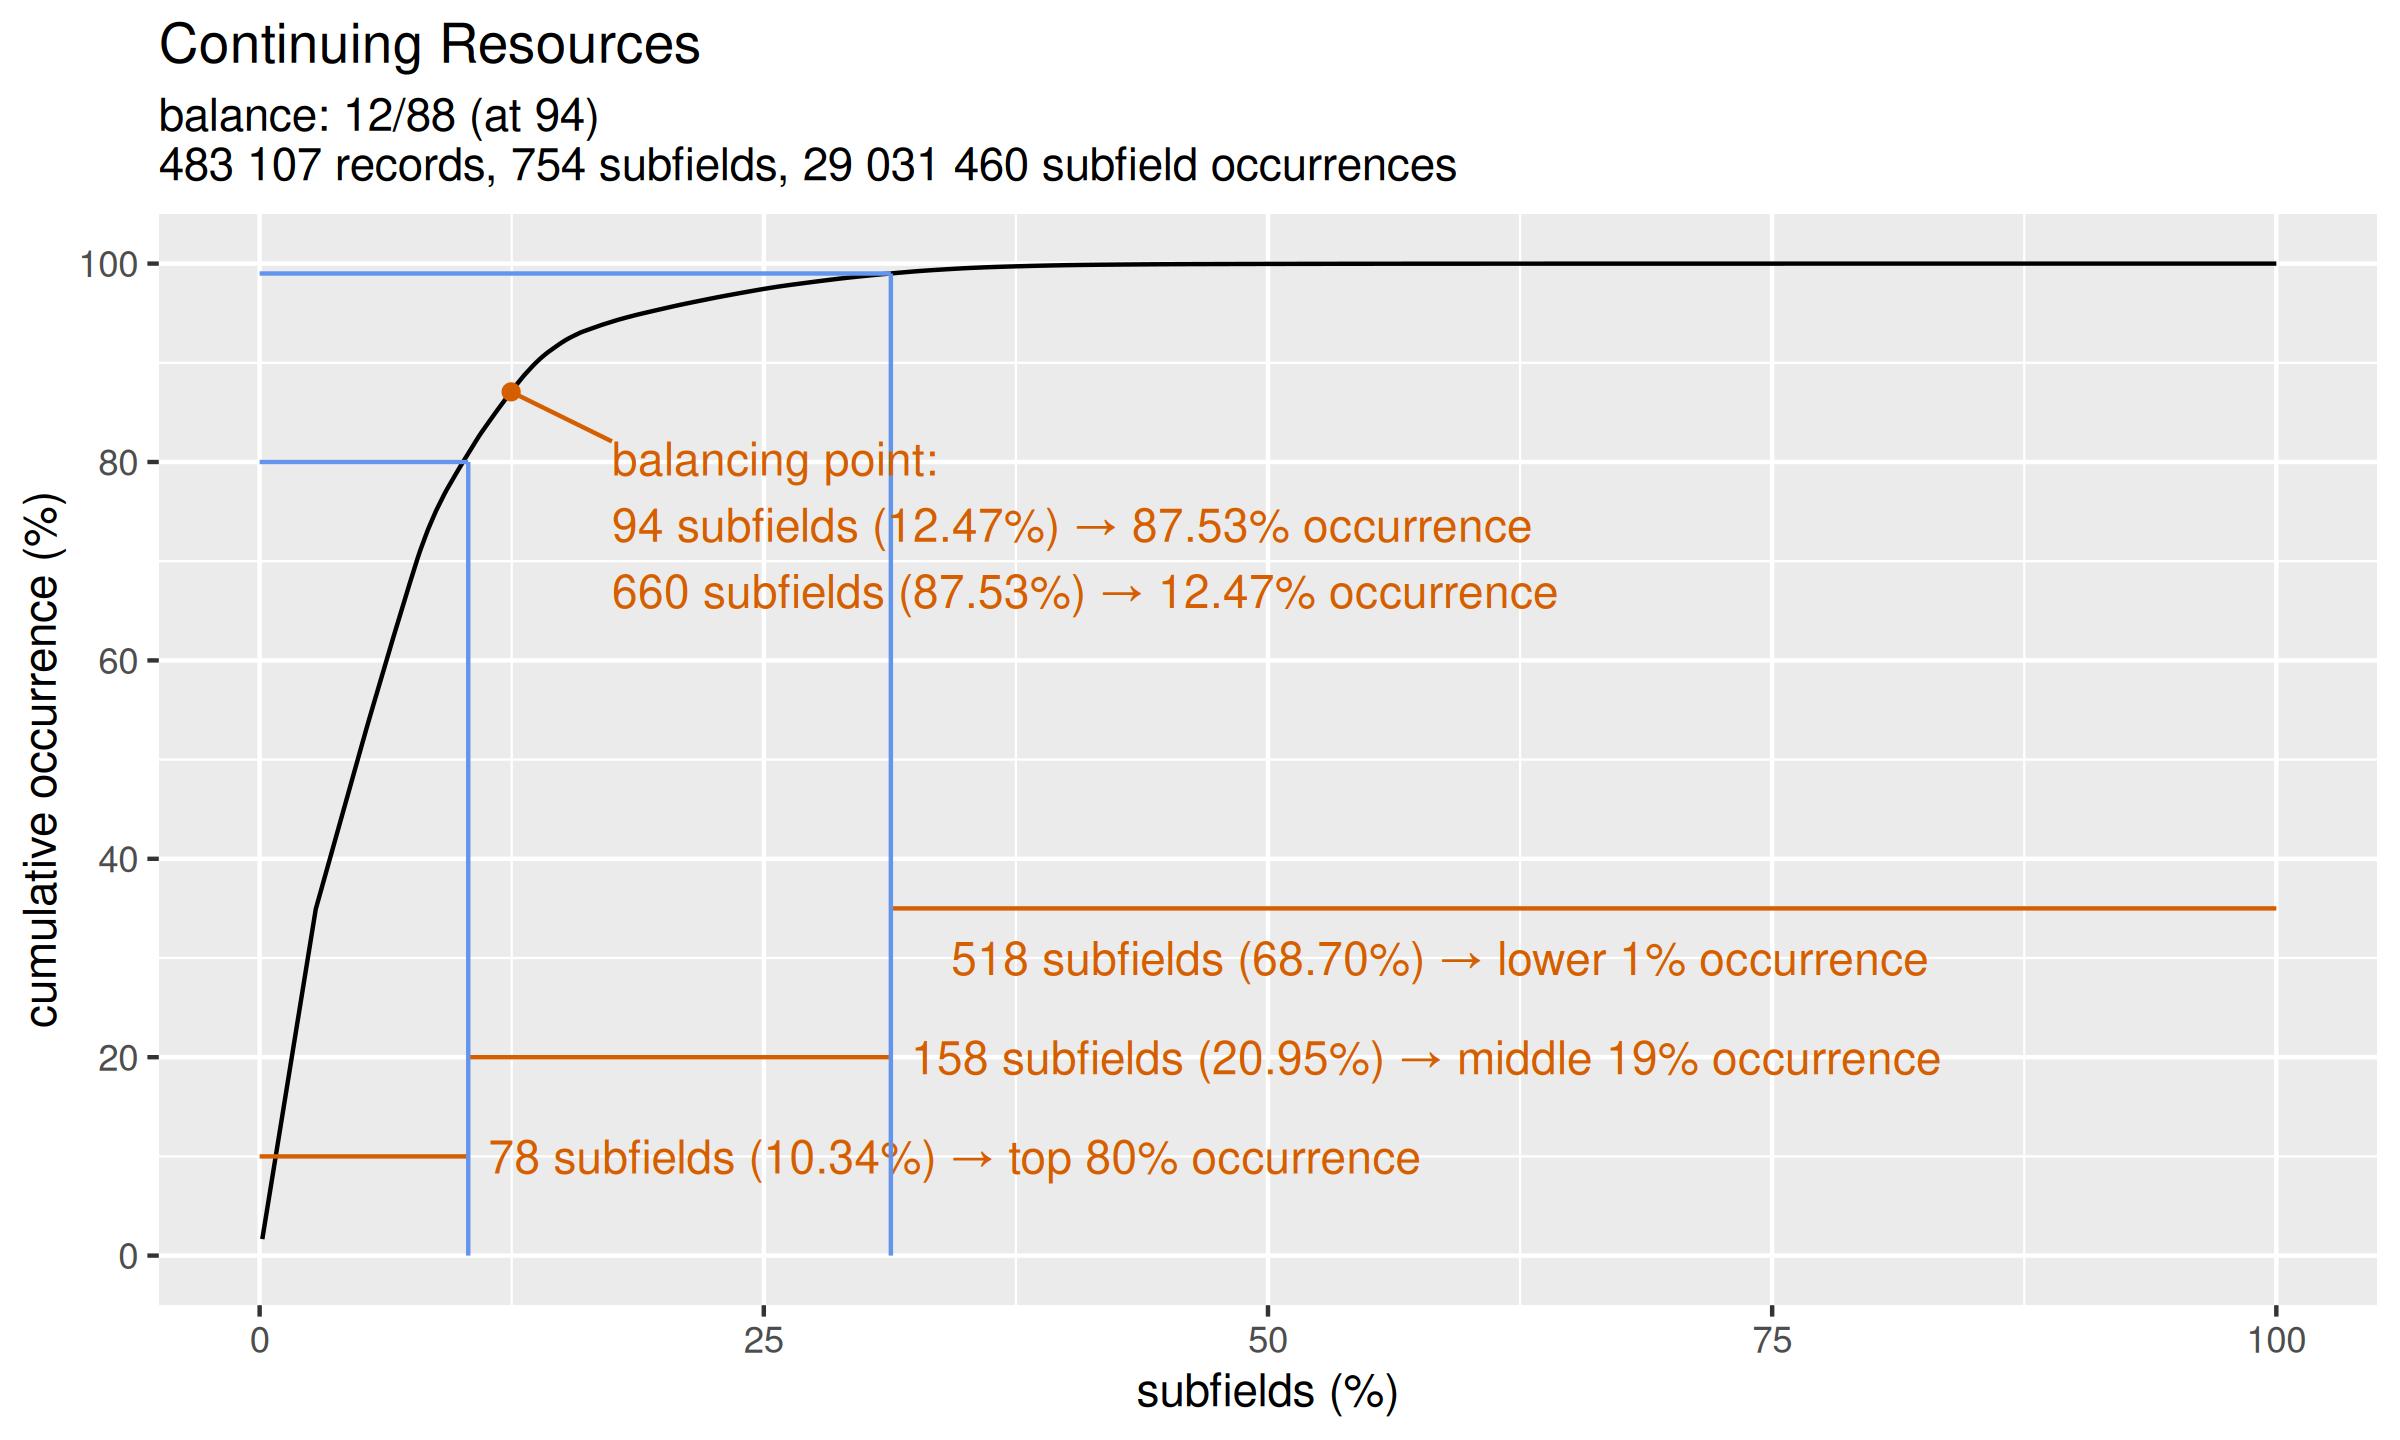
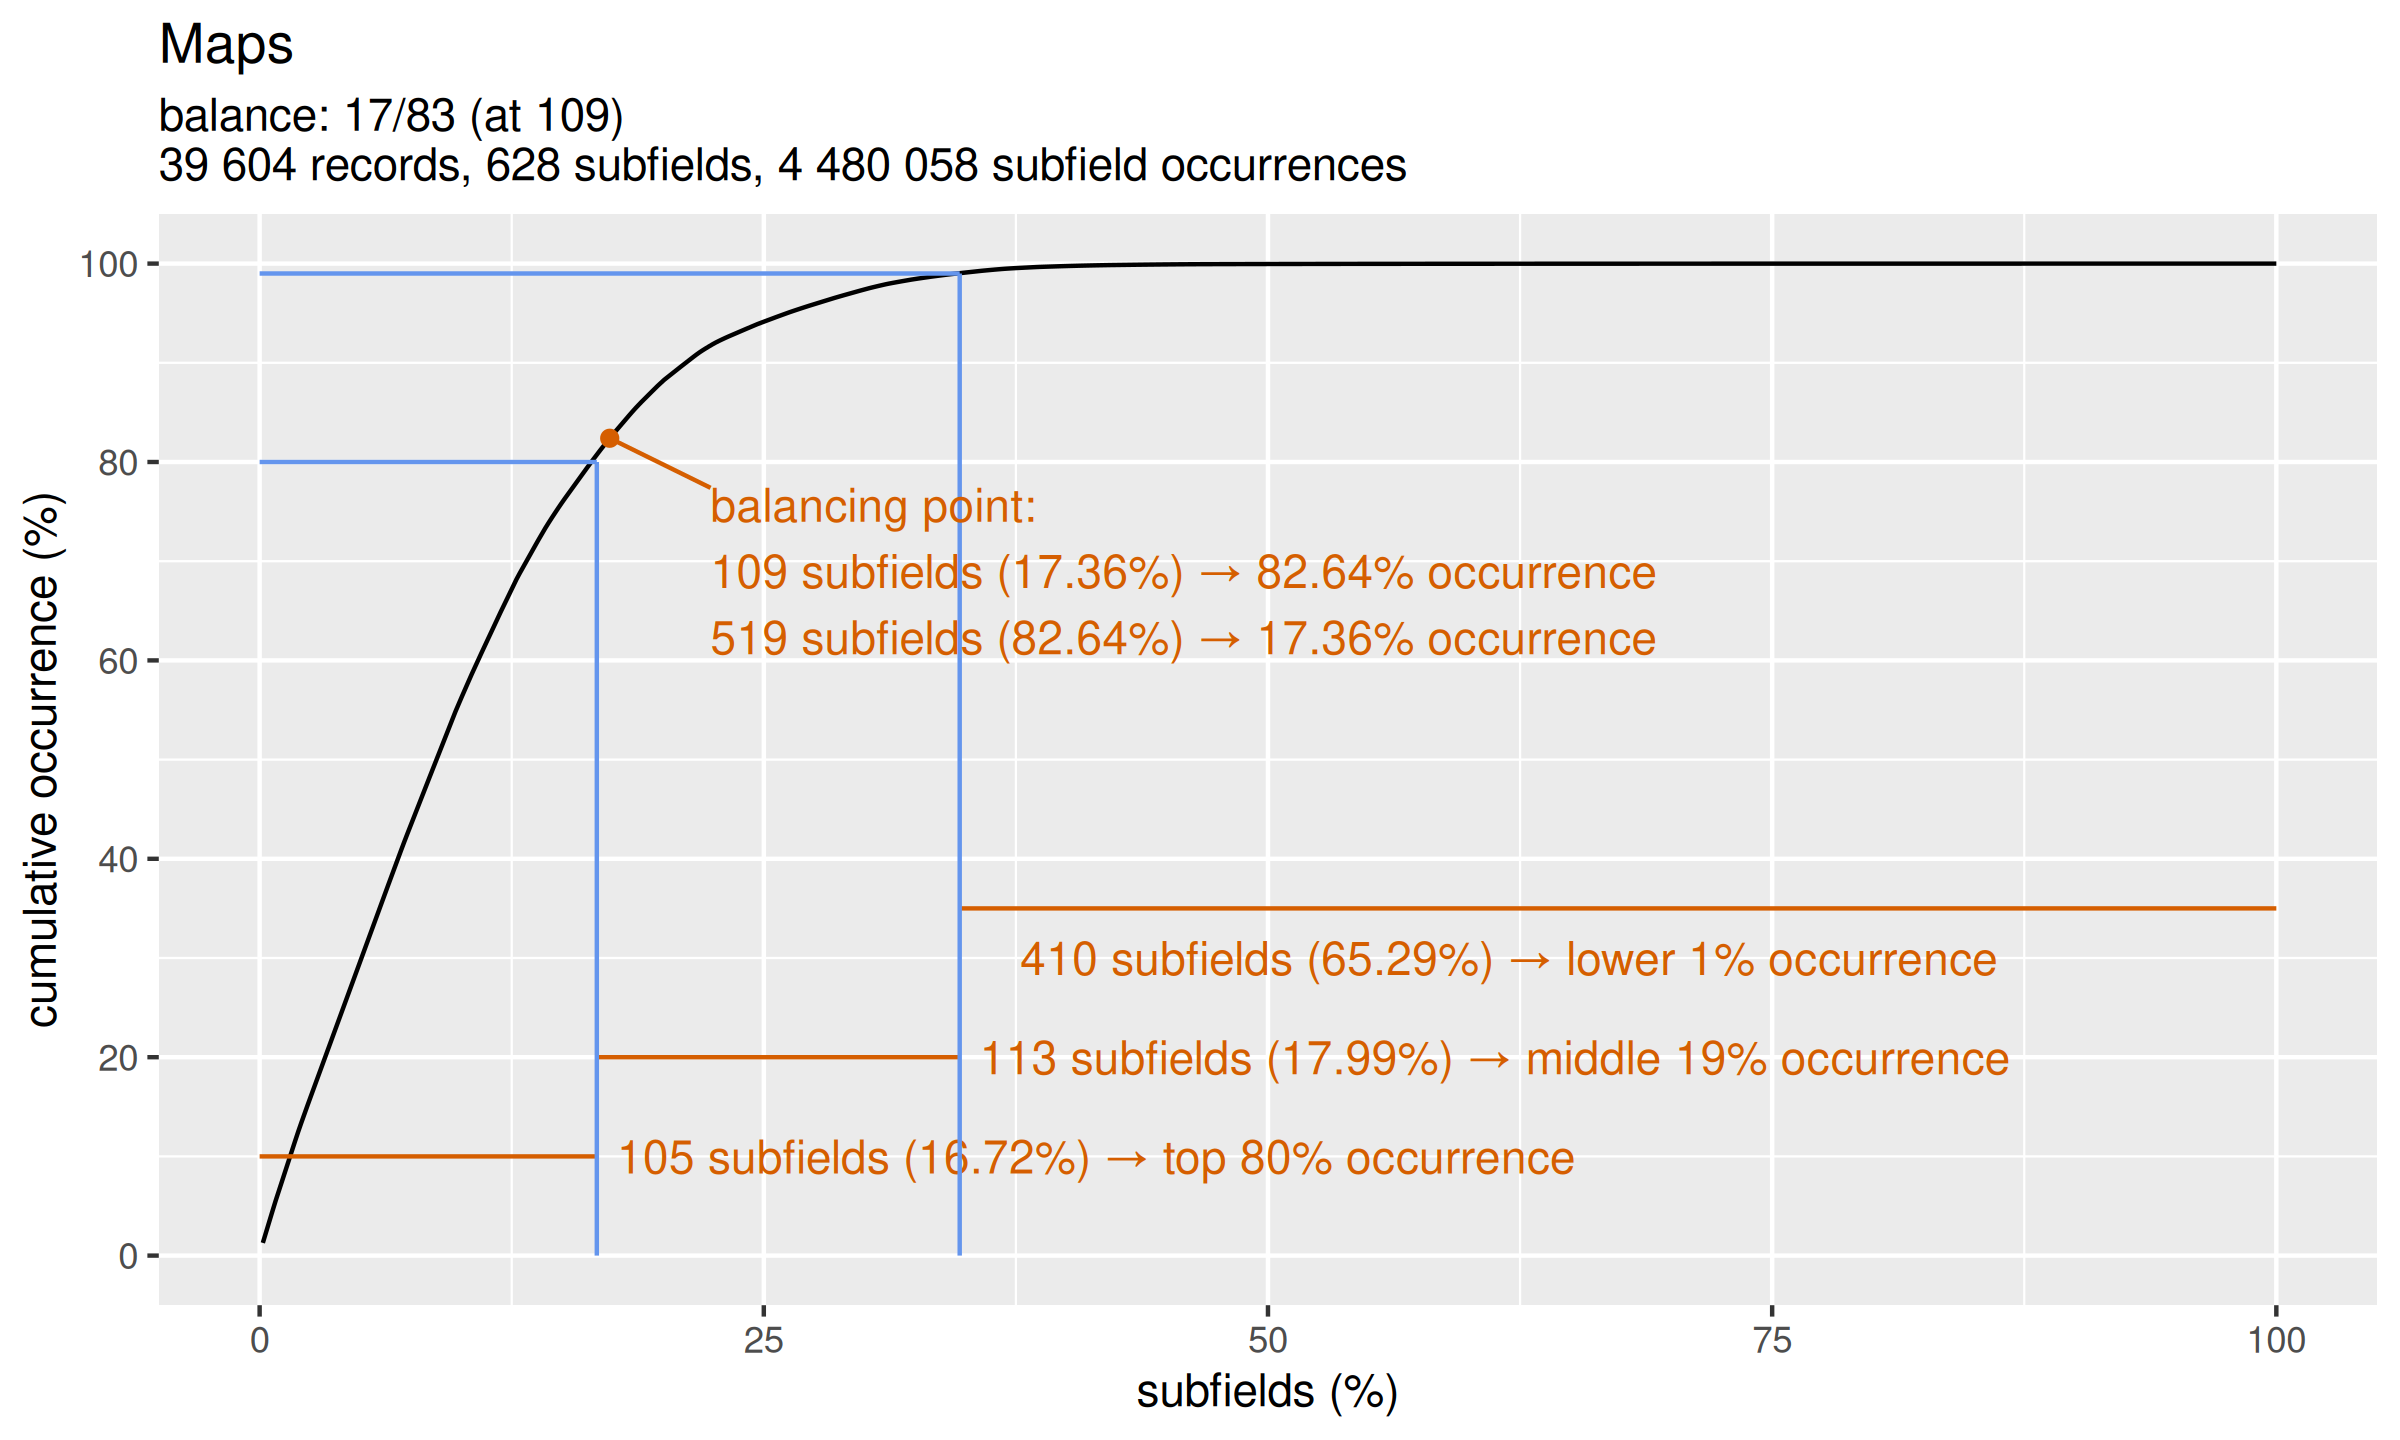
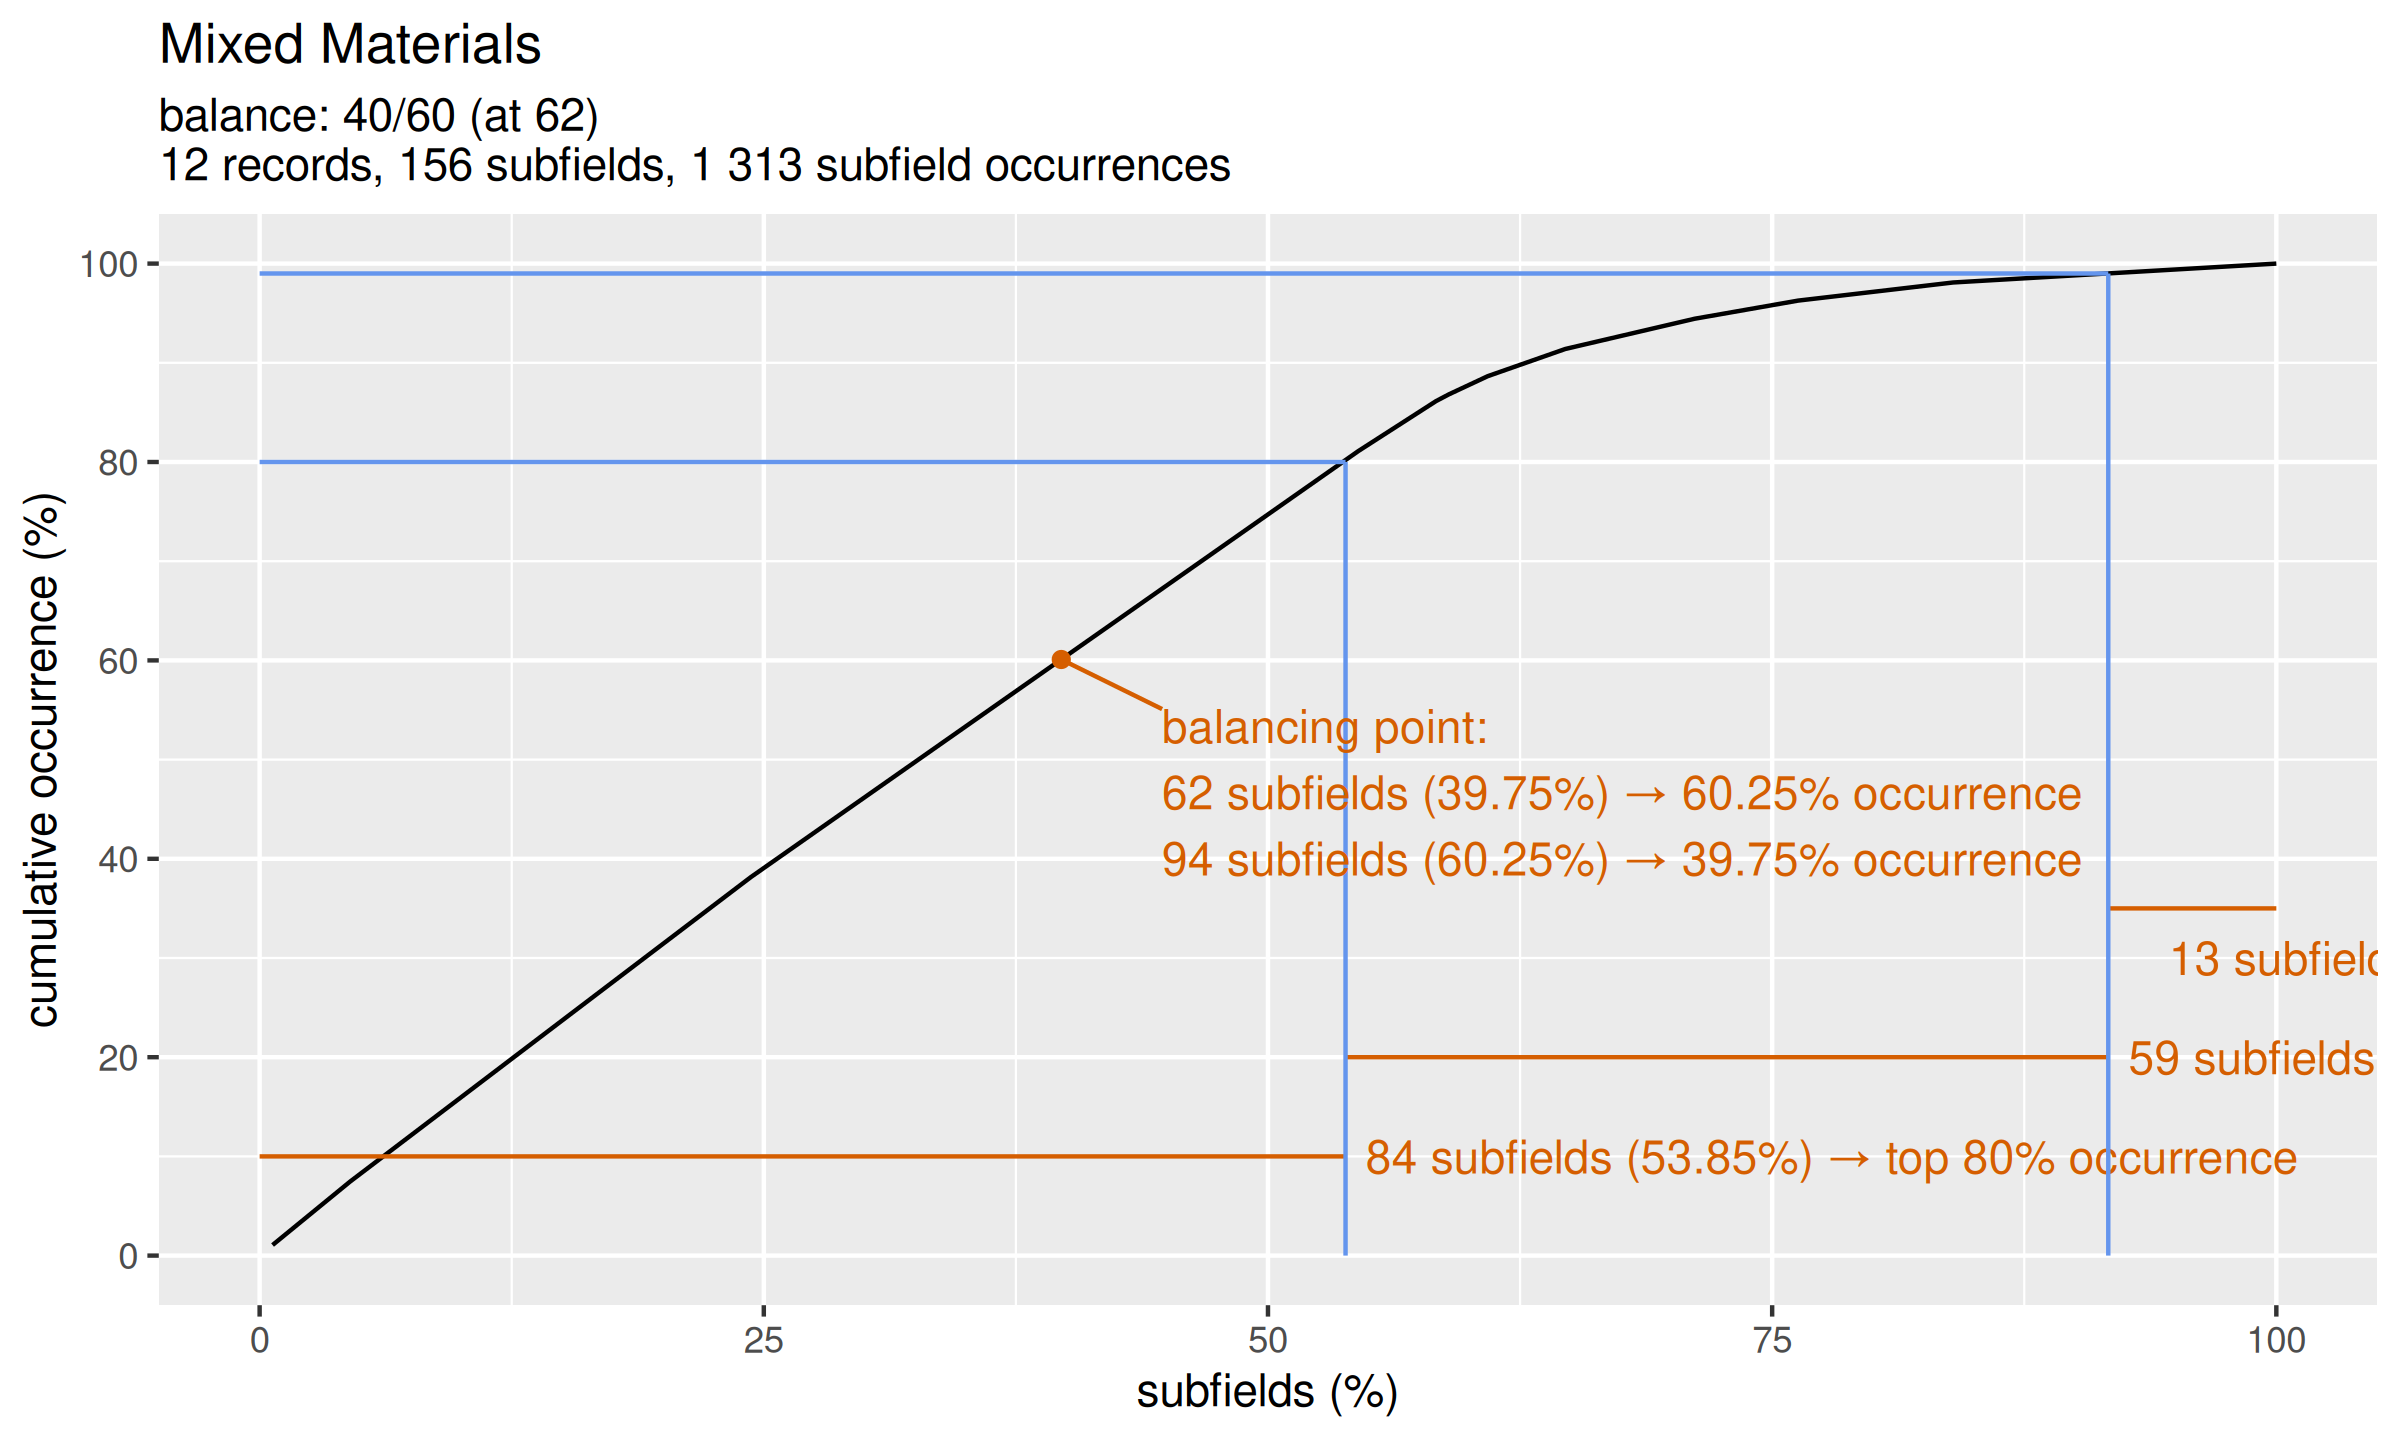
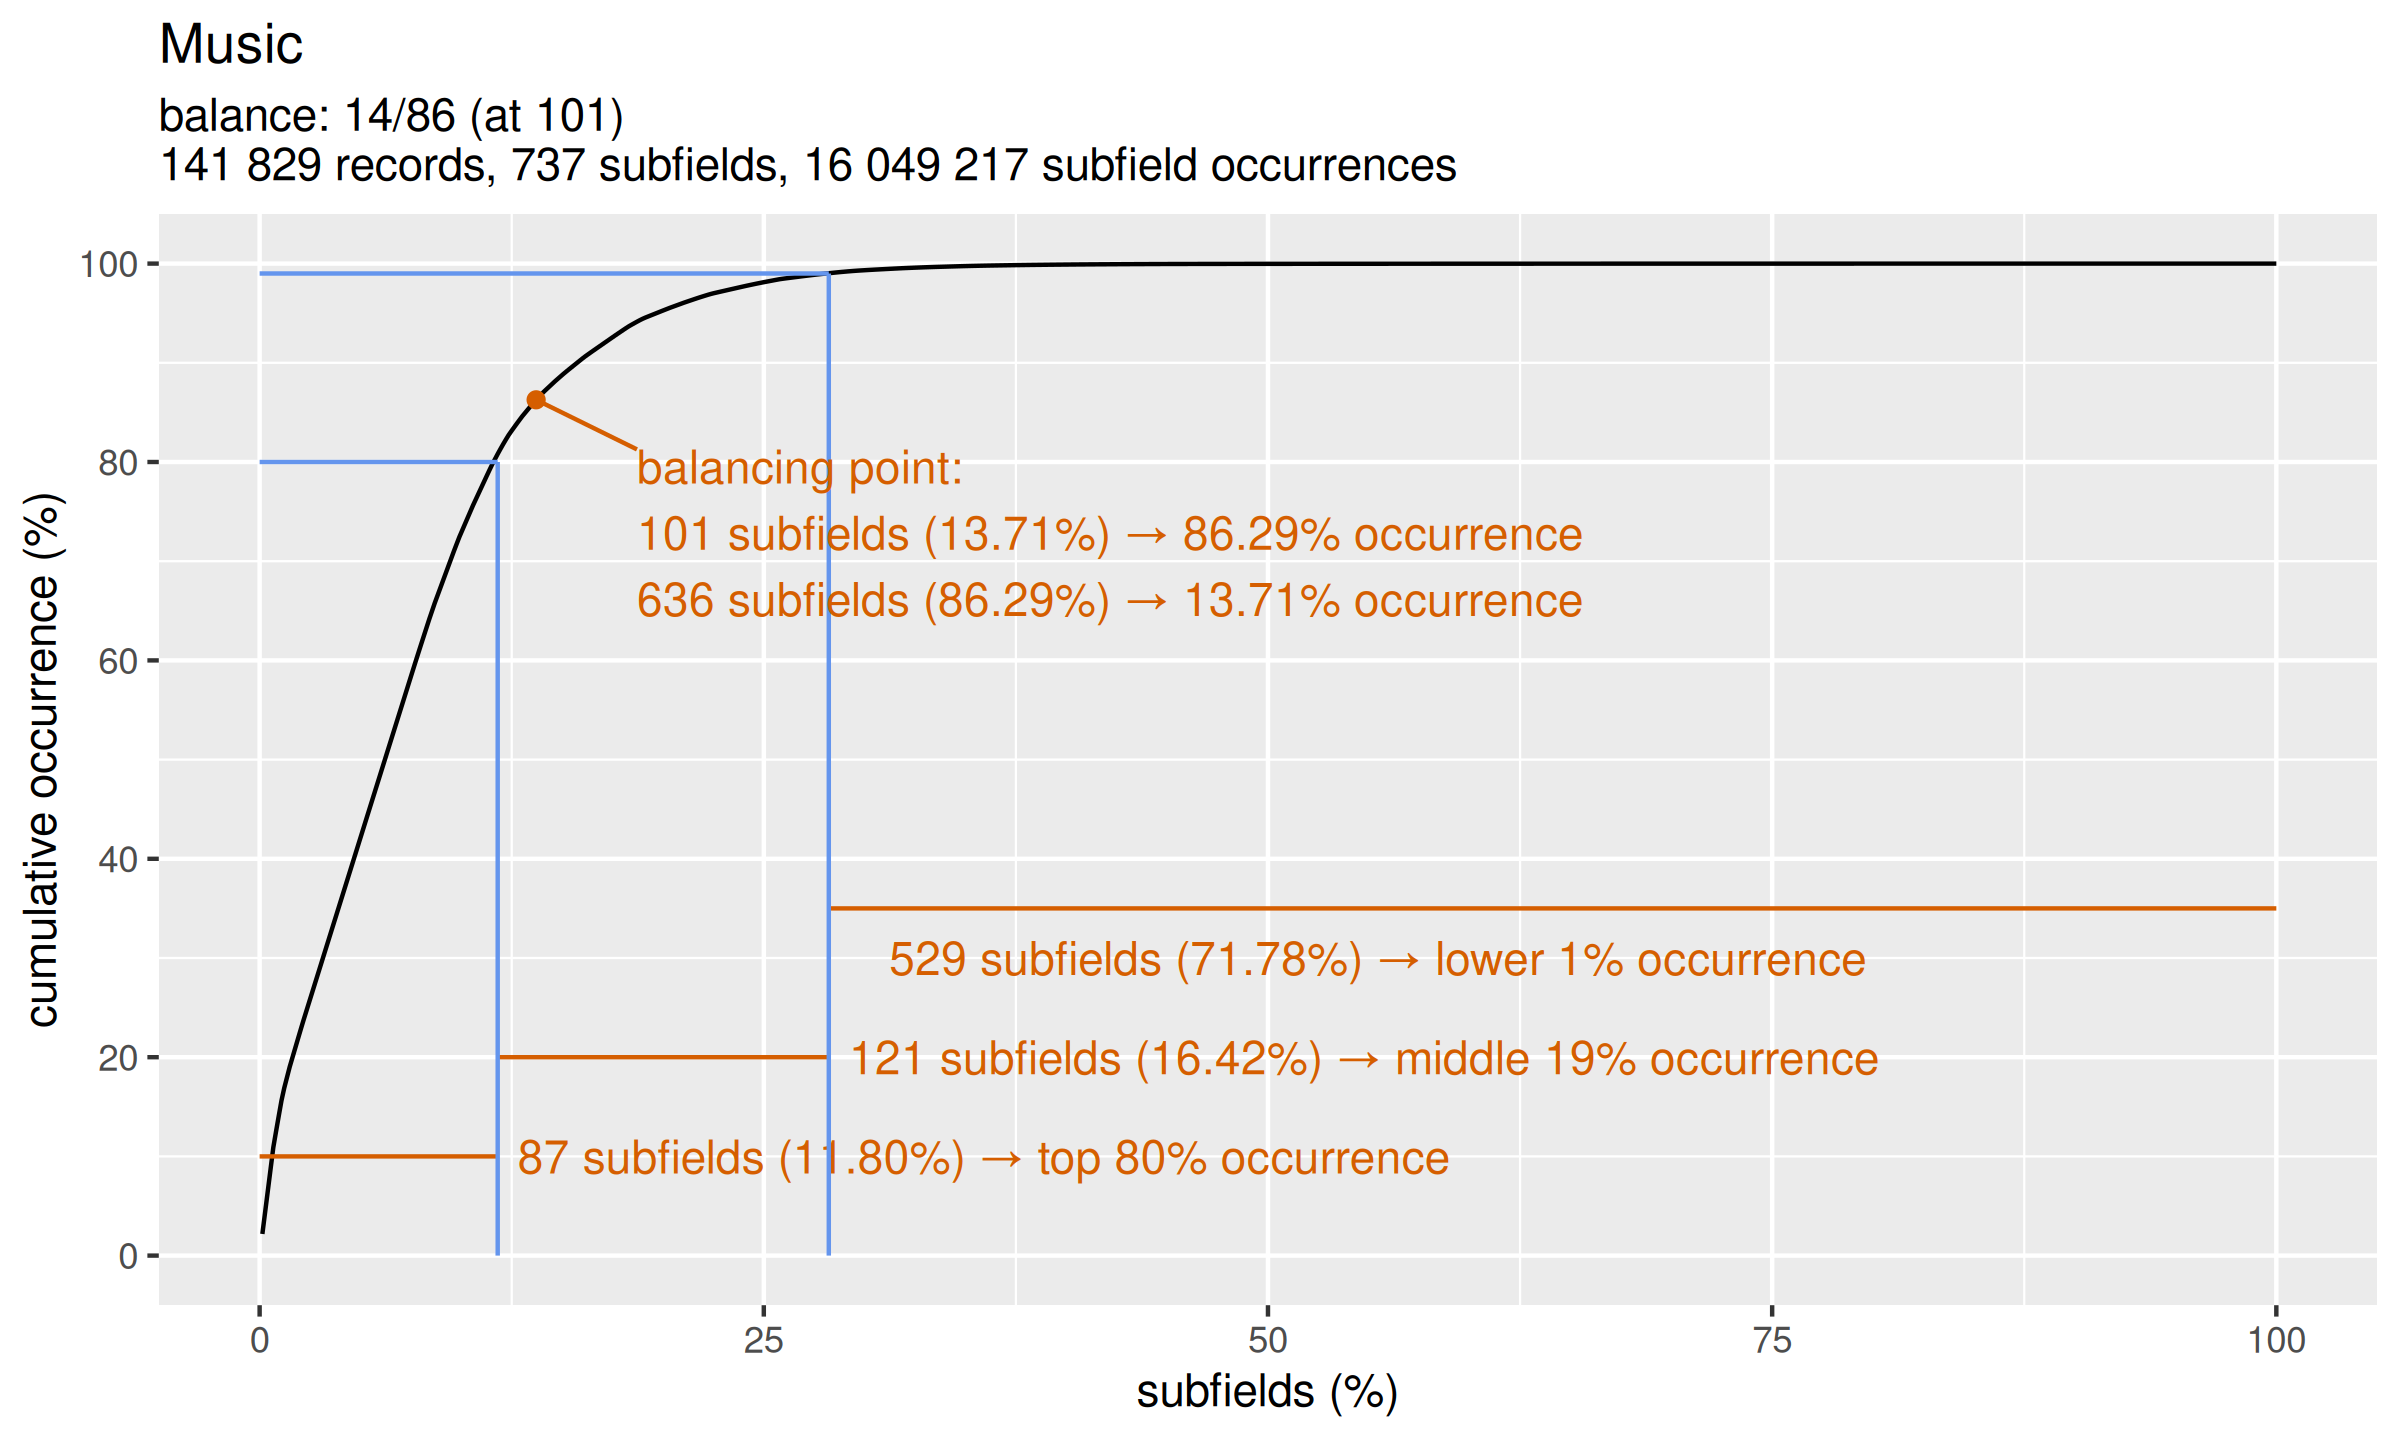
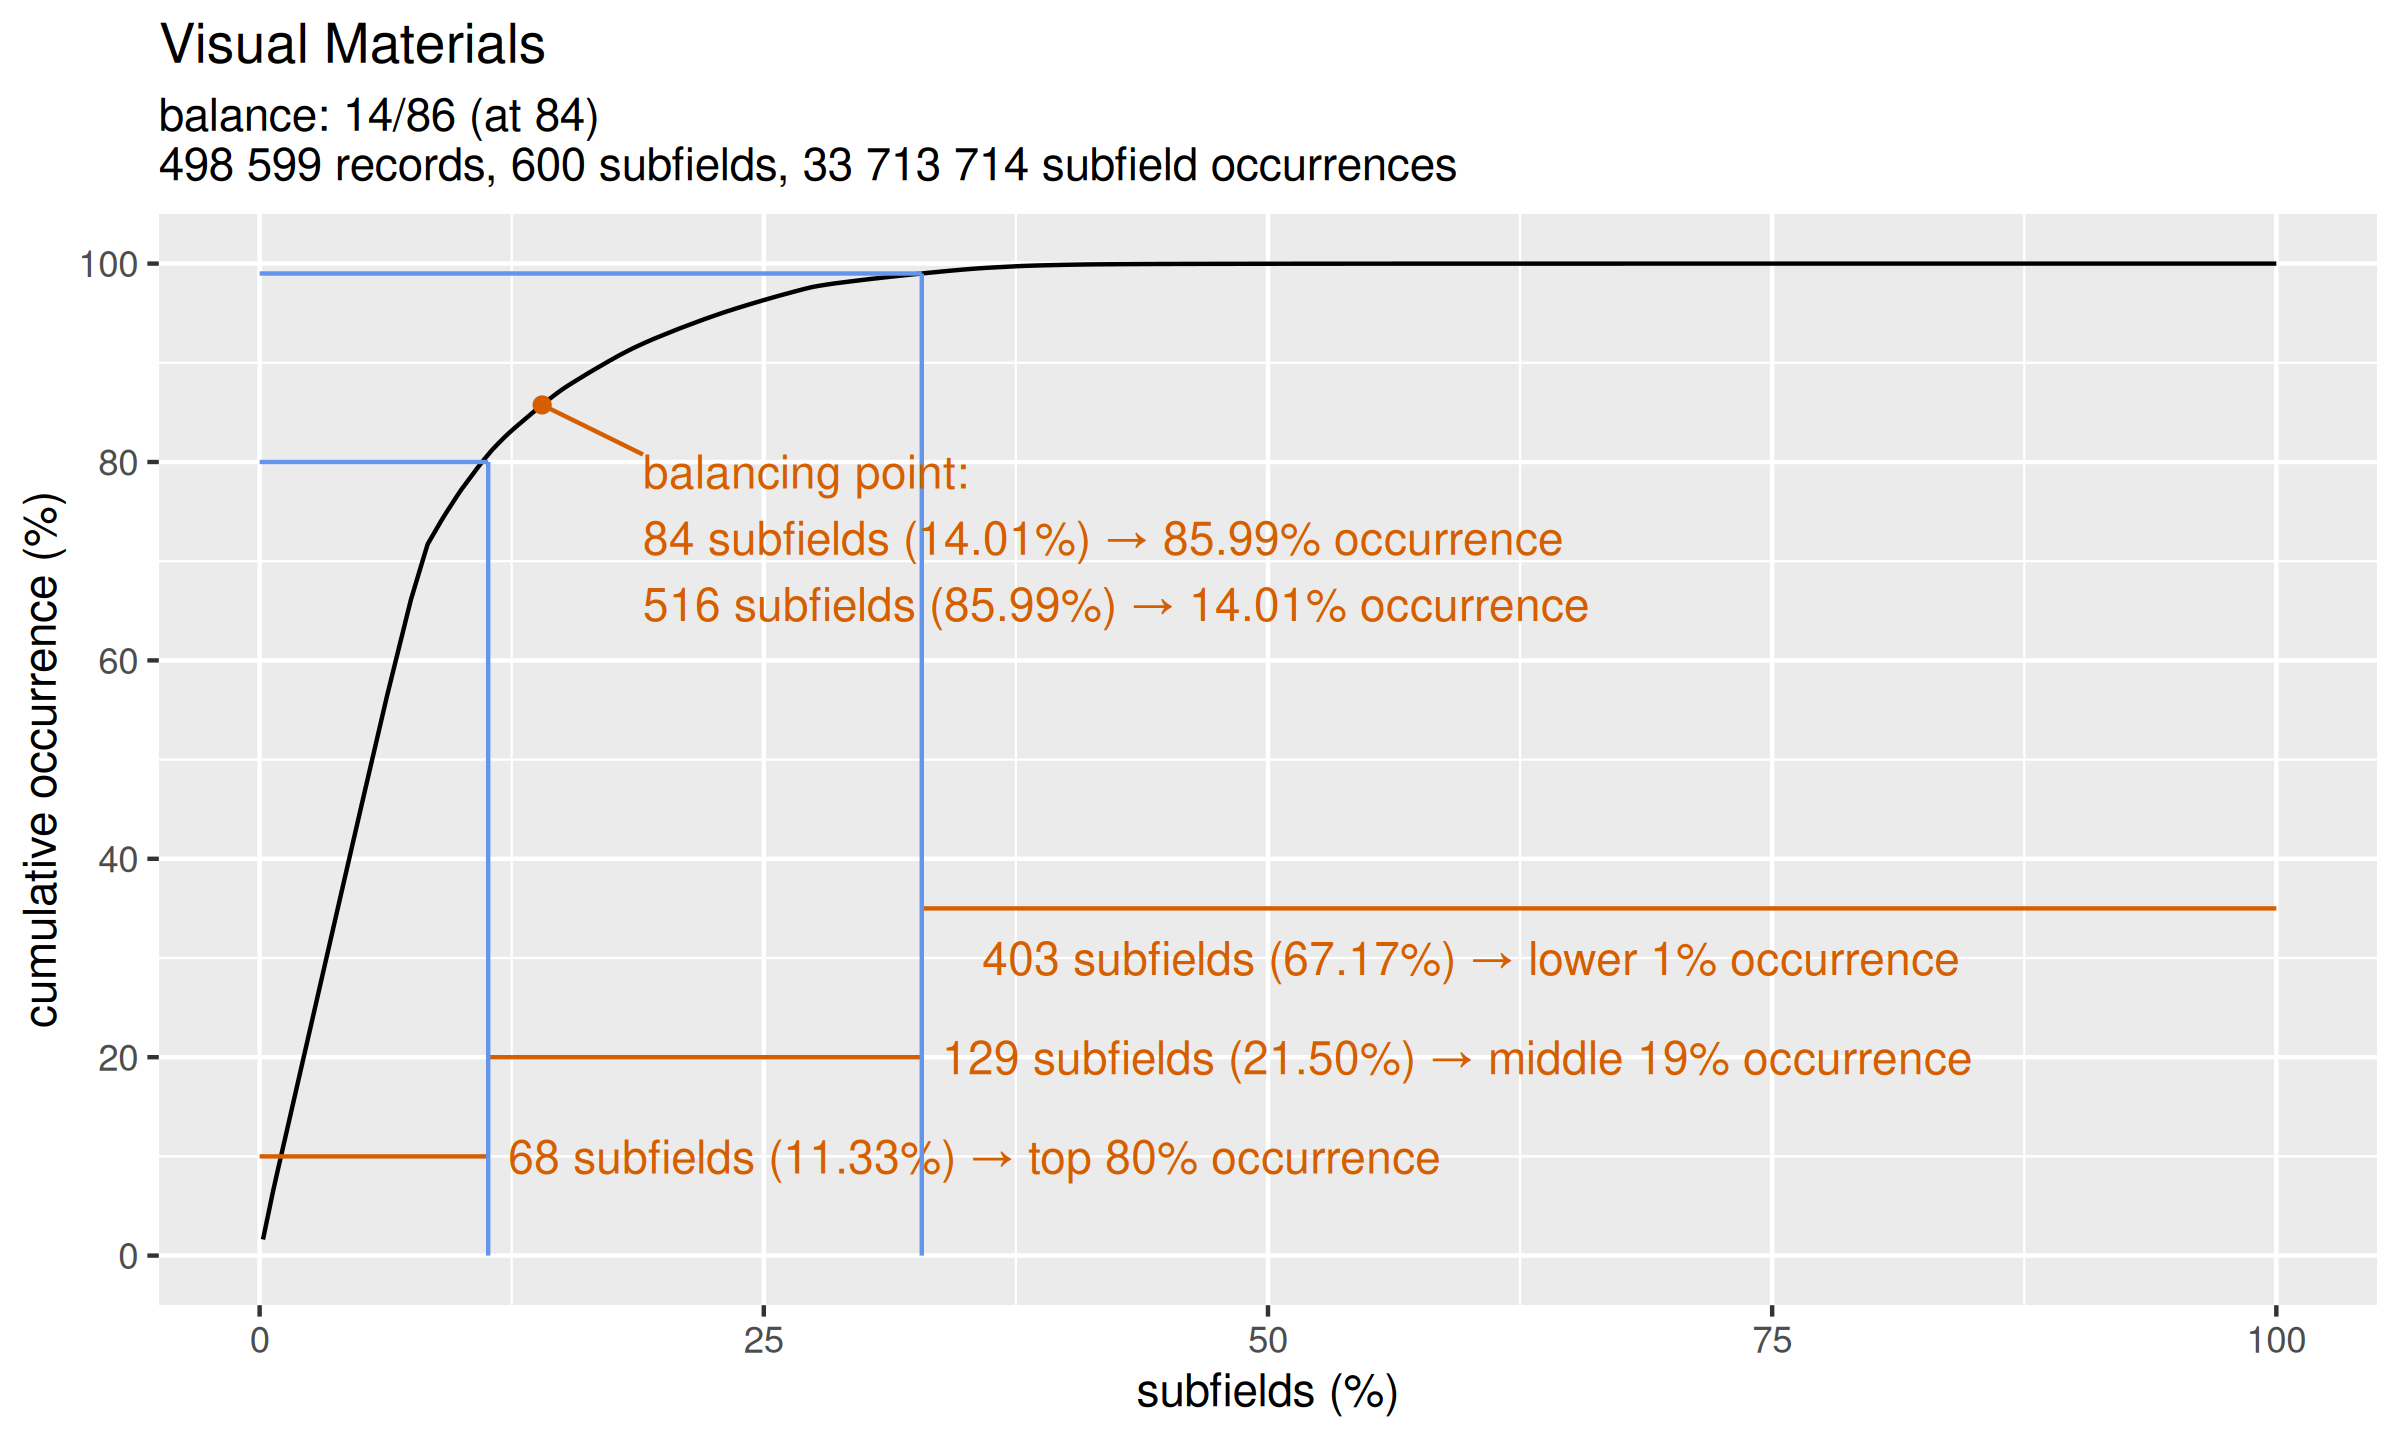
These charts show how the field frequency patterns. Each chart shows a line which is the function of field frequency: on the x axis you can see the subfields ordered by the frequency (how many time a given subfield occured in the whole catalogue). They are ordered by frequency from the most frequent top 1% to the least frequent 1% subfields. The Y axis represents the cumulative occurrence (from 0% to 100%).
